Here’s GUI (TUI) output of a function with a static variable access:
B+ |0x7ffff7616800 <st32>           test   %edi,%edi                                                                                                                     |
   |0x7ffff7616802 <st32+2>         je     0x7ffff7616811 <st32+17>                                                                                                      |
   |0x7ffff7616804 <st32+4>         mov    %edi,%eax                                                                                                                     |
   |0x7ffff7616806 <st32+6>         bswap  %eax                                                                                                                          |
   |0x7ffff7616808 <st32+8>         mov    %eax,0x200852(%rip)        # 0x7ffff7817060 <st32.yst32>                                                                        |
   |0x7ffff761680e <st32+14>        mov    %edi,%eax                                                                                                                     |
   |0x7ffff7616810 <st32+16>        retq                                                                                                                                 |
  >|0x7ffff7616811 <st32+17>        mov    0x200849(%rip),%edi        # 0x7ffff7817060 <st32.yst32>                                                                        |
   |0x7ffff7616817 <st32+23>        bswap  %edi                                                                                                                          |
   |0x7ffff7616819 <st32+25>        mov    %edi,%eax                                                                                                                     |
   |0x7ffff761681b <st32+27>        retq                                                                                                                                 |
   |0x7ffff761681c <_fini>          sub    $0x8,%rsp                                                                                                                     |
   |0x7ffff7616820 <_fini+4>        add    $0x8,%rsp                                                                                                                     |
   |0x7ffff7616824 <_fini+8>        retq                                                                                                                                 |
   |0x7ffff7616825                  add    %al,(%rcx)                                                                                                                    |
   |0x7ffff7616827 <x16+1>          add    (%rcx),%al                                                                                                                    |
   +---------------------------------------------------------------------------------------------------------------------------------------------------------------------+
The associated code is:
int st32( int v ) {
    static int yst32 = 0x1a2b3c4d;

    if ( v ) {
        yst32 = v;
    }

    return yst32;
}
The object code dump (prior to relocation) just has zeros in the offset for the variable:
$ objdump -d g.bs.o | grep -A12 '<st32>'
0000000000000050 <st32>:
  50:   85 ff                   test   %edi,%edi
  52:   74 0d                   je     61 <st32+0x11>
  54:   89 f8                   mov    %edi,%eax
  56:   0f c8                   bswap  %eax
  58:   89 05 00 00 00 00       mov    %eax,0x0(%rip)        # 5e <st32+0xe>
  5e:   89 f8                   mov    %edi,%eax
  60:   c3                      retq
  61:   8b 3d 00 00 00 00       mov    0x0(%rip),%edi        # 67 <st32+0x17>
  67:   0f cf                   bswap  %edi
  69:   89 f8                   mov    %edi,%eax
  6b:   c3                      retq
The linker has filled in the real offsets in question, and the dynamic loader has collaborated to put the data segment in the desired location.
The observant reader may notice bwsap instructions in the listings above that don’t make sense for x86_64 code. That is because this code is compiled with an LLVM pass that performs byte swapping at load and store points, making it big endian in a limited fashion.
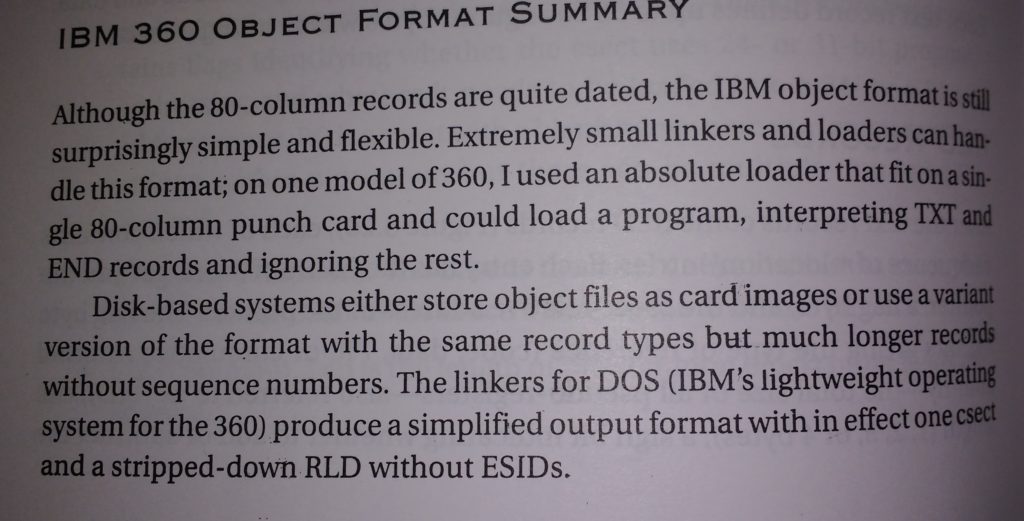
The book Linkers and Loaders has some nice explanation of how relocation works, but I wanted to see the end result first hand in the debugger. It turned out that my naive expectation that the sum of $rip and the constant relocation factor is the address of the global variable (actually static in this case) is incorrect. Check that out in the debugger:
(gdb) p /x 0x200849+$rip
$1 = 0x7ffff781705a

(gdb) x/10 $1
0x7ffff781705a <gy+26>: 0x22110000      0x2b1a4433      0x00004d3c      0x00000000
0x7ffff781706a: 0x00000000      0x00000000      0x00000000      0x30350000
0x7ffff781707a: 0x20333236      0x64655228
My magic value 0x1a2b3c4d looks like it is 6 bytes into the $rip + 0x200849 location that the disassembly appears to point to, and that is in fact the case:
(gdb) x/10 $1+6
0x7ffff7817060 <st32.yst32>:      0x4d3c2b1a      0x00000000      0x00000000      0x00000000
0x7ffff7817070 <y32>:   0x00000000      0x00000000      0x32363035      0x52282033
0x7ffff7817080: 0x48206465      0x34207461
My guess was the mysterious offset of 6 required to actually find this global address was the number of bytes in the MOV instruction, and sure enough that MOV is 6 bytes long:
(gdb) disassemble /r
Dump of assembler code for function st32:
   0x00007ffff7616800 <+0>:     85 ff   test   %edi,%edi
   0x00007ffff7616802 <+2>:     74 0d   je     0x7ffff7616811 <st32+17>
   0x00007ffff7616804 <+4>:     89 f8   mov    %edi,%eax
   0x00007ffff7616806 <+6>:     0f c8   bswap  %eax
   0x00007ffff7616808 <+8>:     89 05 52 08 20 00       mov    %eax,0x200852(%rip)        # 0x7ffff7817060 <st32.yst32>
   0x00007ffff761680e <+14>:    89 f8   mov    %edi,%eax
   0x00007ffff7616810 <+16>:    c3      retq
=> 0x00007ffff7616811 <+17>:    8b 3d 49 08 20 00       mov    0x200849(%rip),%edi        # 0x7ffff7817060 <st32.yst32>
   0x00007ffff7616817 <+23>:    0f cf   bswap  %edi
   0x00007ffff7616819 <+25>:    89 f8   mov    %edi,%eax
   0x00007ffff761681b <+27>:    c3      retq
End of assembler dump.
So, it appears that the %rip reference in the disassembly is really the value of the instruction pointer after the instruction executes, which is curious.
Note that this 4 byte relocation requires the shared library code segment and the shared library data segment be separated by no more than 4G. The linux dynamic loader has put all the segments back to back so that this is the case. This can be seen from /proc/PID/maps for the process:
$ ps -ef | grep maindl
pjoot    17622 17582  0 10:50 pts/3    00:00:00 /home/pjoot/workspace/pass/global/maindl libglobtestbs.so

$ grep libglob /proc/17622/maps
7ffff7616000-7ffff7617000 r-xp 00000000 fc:00 2492653                    /home/pjoot/workspace/pass/global/libglobtestbs.so
7ffff7617000-7ffff7816000 ---p 00001000 fc:00 2492653                    /home/pjoot/workspace/pass/global/libglobtestbs.so
7ffff7816000-7ffff7817000 r--p 00000000 fc:00 2492653                    /home/pjoot/workspace/pass/global/libglobtestbs.so
7ffff7817000-7ffff7818000 rw-p 00001000 fc:00 2492653                    /home/pjoot/workspace/pass/global/libglobtestbs.so
We’ve got a read-execute mmap region, where the code lies, and a read-write mmap region for the data. There’s a read-only segment which I presume is for read only global variables (my shared lib has one such variable and we have one page worth of space allocated for read only memory).
I wonder what the segment that has none of the read, write, nor execute permissions set is?
Like this:
Like Loading...


