lldb

Multilanguage debugging in lldb: print call to function.

December 13, 2023 C/C++ development and debugging. , , , , , ,

There probably aren’t many people that care about debugging multiple languages, but I learned a new trick today that is worth making a note of, even if that note is for a future amnesiatic self.

Here’s a debug session where C code is calling COBOL, but in the COBOL frame, the language rules prohibit running print to show the results of a C function call (example: printf, strlen, strspn, …)

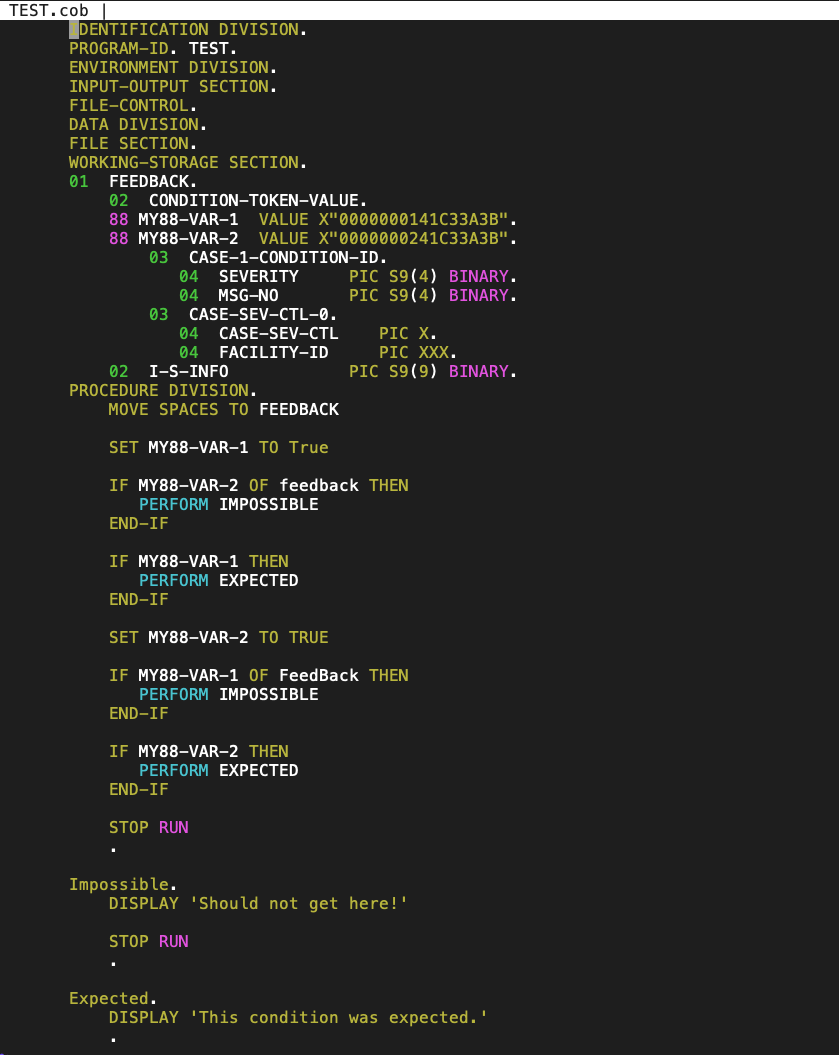
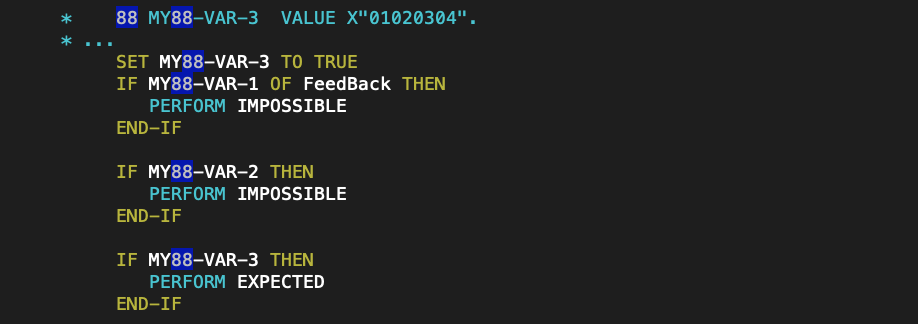
To make a function call in lldb, I used to go up the stack to a C language frame.  For example, if this was the COBOL code I was debugging:
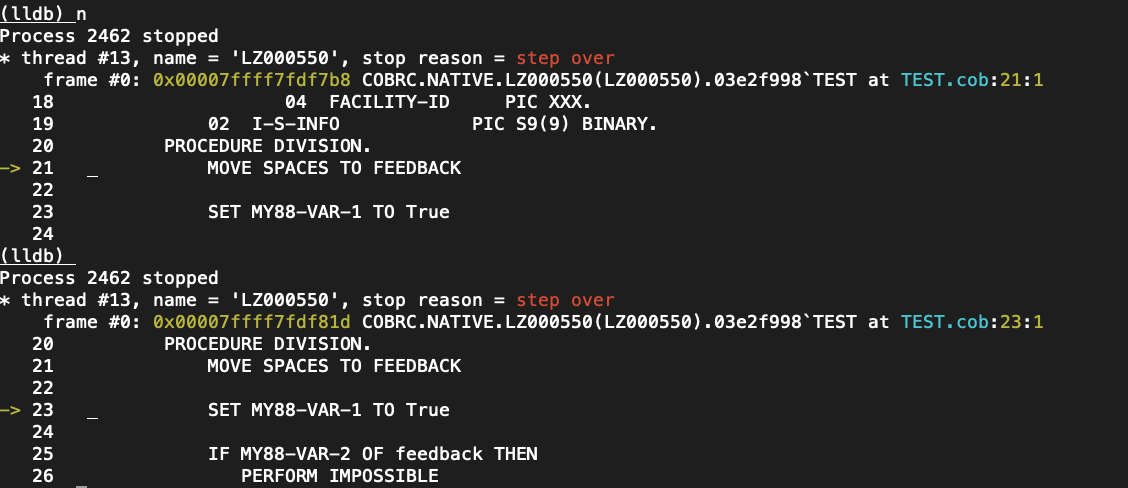
(lldb) n
12/13/23 19:27:26 LTE14039I Opening LzMQZ connection. QMGR: MQZ1 MQZCONN: 0x7ff920625170 API: 0x7fed0008e0e0
Process 1673776 stopped
* thread #57, name = 'LZOCREG1', stop reason = step over
    frame #0: 0x00007ff9243b31f2 WINDC.NATIVE.LZPDS.A0116662(LTESVCXC).f3968a73`LTESVCXC at LTESVCXC.cbl:36:1
   33  
   34                  DISPLAY 'WSCHECK: "' WORK-VAR '"'
   35  
-> 36                 EXEC CICS LINK PROGRAM ('LTESVCXC')
   37                      COMMAREA(WORK-COMMAREA)
   38                      LENGTH   (LENGTH OF WORK-COMMAREA)
   39                 END-EXEC
(lldb) p &WORK-VAR
(*char [10]) $4 = 0x00007fadef810478
(lldb) p WORK-VAR
(char [10]) WORK-VAR = "STORISOK  "
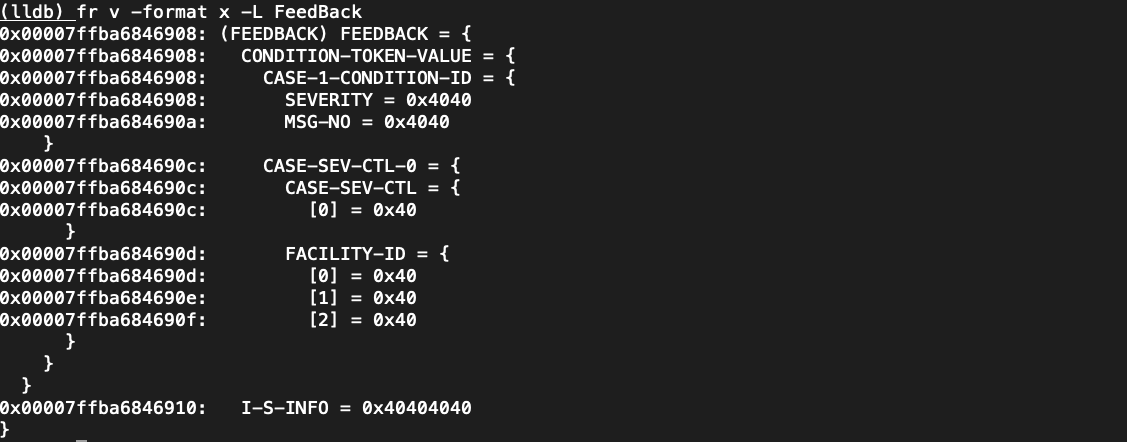
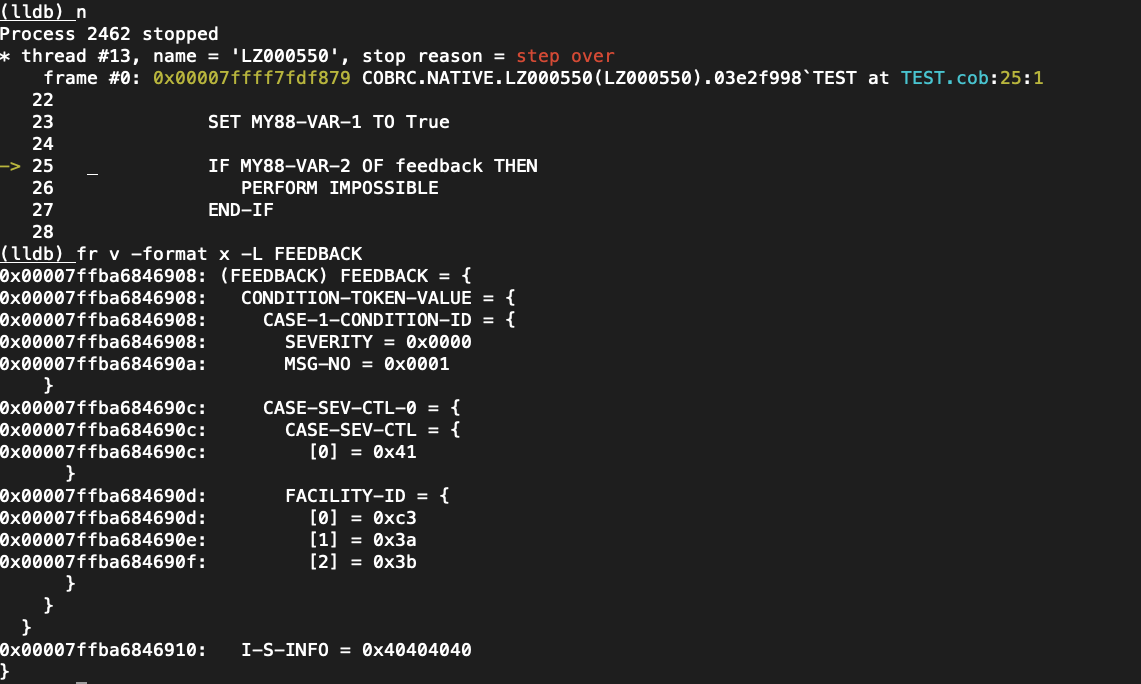
(lldb) fr v -format x WORK-VAR
(char [10]) WORK-VAR = {
  [0] = 0xe2
  [1] = 0xe3
  [2] = 0xd6
  [3] = 0xd9
  [4] = 0xc9
  [5] = 0xe2
  [6] = 0xd6
  [7] = 0xd2
  [8] = 0x40
  [9] = 0x40
}

Aside: If you object to the use of a C address-of operator against a COBOL variable, that’s just because our debugger has C like & notational shorthand for the COBOL ‘ADDRESS OF …’, which is very useful.

If I want to run a C function against that COBOL WORKING-STORAGE variable, like strchr, to look for the address of the first EBCDIC space (0x40) in that string, I used to do it by going up the stack into a C frame, like so:

(lldb) up 2
frame #2: 0x00007ff9243b3f7e WINDC.NATIVE.LZPDS.A0116662(LTESVCXC).f3968a73`pgm_ltesvcxc + 382
WINDC.NATIVE.LZPDS.A0116662(LTESVCXC).f3968a73`pgm_ltesvcxc:
->  0x7ff9243b3f7e <+382>: jmp    0x7ff9243b3f88            ; <+392>
    0x7ff9243b3f80 <+384>: addq   $0x128, %rsp              ; imm = 0x128 
    0x7ff9243b3f87 <+391>: retq   
    0x7ff9243b3f88 <+392>: leaq   0x201039(%rip), %rdi
(lldb) print (char *)strchr(0x00007fadef810478, 0x40)
(char *) $6 = 0x00007fadef810480 "@@"

Sure enough, that space is found 8 bytes into the string, as expected. This is a very short string, and I could have seen that by inspection, but it’s just to illustrate that we can make calls to functions within the debugger, and they can even be functions that aren’t in the program or language that we are debugging.

I noticed today that ‘print’ is an alias for ‘expression –‘, and that expression takes a language option. This means that I can do cross language calls like this in any frame, provided I specify the language I want. Example:

(lldb) down 2
frame #0: 0x00007ff9243b31f2 WINDC.NATIVE.LZPDS.A0116662(LTESVCXC).f3968a73`LTESVCXC at LTESVCXC.cbl:36:1
   33  
   34                  DISPLAY 'WSCHECK: "' WORK-VAR '"'
   35  
-> 36                 EXEC CICS LINK PROGRAM ('LTESVCXC')
   37                      COMMAREA(WORK-COMMAREA)
   38                      LENGTH   (LENGTH OF WORK-COMMAREA)
   39                 END-EXEC
(lldb) expression -l c -- (char *)strchr(0x00007fadef810478, 0x40)
(char *) $7 = 0x00007fadef810480 "@@"

Ten points to me for learning yet another obscure debugger trick.

Using the debugger to understand COBOL level 88 semantics.

August 10, 2020 COBOL , ,

COBOL has an enumeration mechanism called a LEVEL-88 variable.  I found a few aspects of this counter-intuitive, as I’ve mentioned in a few previous posts.  With the help of the debugger, I now think I finally understand what’s going on.  Here’s an example program that uses a couple of LEVEL-88 variables:

We can use a debugger to discover the meaning of the COBOL code. Let’s start by single stepping past the first MOVE statement to just before the SET MY88-VAR-1:

Here, I’m running the program LZ000550 from a PDS named COBRC.NATIVE.LZ000550. We expect EBCDIC spaces (‘\x40’) in the FEEDBACK structure at this point and that’s what we see:

Line stepping past the SET statement, our structure memory layout now looks like:

By setting the LEVEL-88 variable to TRUE all the memory starting at the address of feedback is now overwritten by the numeric value 0x0000000141C33A3BL. If we continue the program, the SYSOUT ends up looking like:

This condition was expected.

The first ‘IF MY88-VAR-1 THEN’ fires, and after the subsequent ‘SET MY88-VAR-2 TO TRUE’, the second ‘IF MY88-VAR-2 THEN’ fires. The SET overwrites the structure memory at the point that the 88 was declared, and an IF check of that same variable name checks if the memory in that location has the value in the 88 variable. It does not matter what the specific layout of the structure is at that point. We see that an IF check of the level-88 variable just tests whether or not the value at that address has the pattern specified in the variable. In this case, we have only on level-88 variable with the given name in the program, so the ‘IF MY88-VAR-2 OF feedback’ that was used was redundant, and could have been coded as just ‘IF MY88-VAR-2’, or could have been coded as ‘IF MY88-VAR-2 OF CONDITION-TOKEN-VALUE of Feedback’

We can infer that the COBOL code’s WORKING-STORAGE has the following equivalent C++ layout:

struct CONDITION_TOKEN_VALUE
{
   short SEVERITY;
   short MSG_NO;
   char CASE_SEV_CTL;
   char FACILITY_ID[3];
};

enum my88_vars
{
   MY88_VAR_1 = 0x0000000141C33A3BL,
   MY88_VAR_2 = 0x0000000241C33A3BL
};

struct feedback
{
   union {
      CONDITION_TOKEN_VALUE c;
      my88_vars e;
   } u;
   int I_S_INFO;
};

and that the control flow of the program can be modeled as the following:

//...
feedback f;

int main()
{
   memset( &f, 0x40, sizeof(f) );
   f.u.e = MY88_VAR_1;
   if ( f.u.e == MY88_VAR_2 )
   {
      impossible();
   }
   if ( f.u.e == MY88_VAR_1 )
   {
      expected();
   }

   f.u.e = MY88_VAR_2;
   if ( f.u.e == MY88_VAR_1 )
   {
      impossible();
   }
   if ( f.u.e == MY88_VAR_2 )
   {
      expected();
   }

   return 0;
}

Things also get even more confusing if the LEVEL-88 variable specifies less bytes than the structure that it is embedded in.  In that case, SET of the variable pads out the structure with spaces and a check of the variable also looks for those additional trailing spaces:

The CONDITION-TOKEN-VALUE object uses a total of 8 bytes.  We can see the spaces in the display of the FEEDBACK structure if we look in the debugger:

See the four trailing 0x40 spaces here.

Incidentally, it can be hard to tell what the total storage requirements of a COBOL structure is by just looking at the code, because the mappings between digits and storage depends on the usage clauses.  If the structure also uses REDEFINES clauses (embedded unions), as was the case in the program that I was originally looking at, the debug output is also really nice to understand how big the various fields are, and where they are situated.

Here are a few of the lessons learned:

  • You might see a check like ‘IF MY88-VAR-1 THEN’, but nothing in the program explicitly sets MY88-VAR-1. It is effectively a global variable value that is set as a side effect of some other call (in the real program I was looking at, what modified this “variable” was actually a call to CEEFMDA, a LE system service.) We have pass by reference in the function calls so it can be a reverse engineering task to read any program and figure out how any given field may have been modified, and that doesn’t get any easier by introducing LEVEL-88 variables into the mix.
  • This effective enumeration mechanism is not typed in any sense. Correct use of a LEVEL-88 relies on the variables that follow it to have the appropriate types. In this case, the ‘IF MY88-VAR-1 THEN’ is essentially shorthand for:
  • There is a disconnect between the variables modified or checked by a given LEVEL-88 variable reference that must be inferred by the context.
  • An IF check of a LEVEL-88 variable may include an implicit check of the trailing part of the structure with EBCDIC spaces, if the fields that follow the 88 variable take more space than the value of the variable. Similarly, seting such a variable to TRUE may effectively memset a trailing subset of the structure to EBCDIC spaces.
  • Exactly what is modified by a given 88 variable depends on the context.  For example, if the level 88 variables were found in a copybook, and if I had a second structure that had the same layout as FEEDBACK, with both structures including that copybook, then I’d have two instances of this “enumeration”, and would need a set of “OF foo OF BAR” type clauses to disambiguate things.  Level 88 variables aren’t like a set of C defines.  Their meaning is context dependent, even if they masquerade as constants.

The lldb TUI (text user interface)

August 26, 2019 C/C++ development and debugging. , , ,

It turns out, like GDB, that lldb has a TUI mode too, but it’s really simplistic.  You enter with

(lldb) gui

at which point you get a full screen of code or assembly, and options for register exploration, thread and stack exploration, and a variable view.  The startup screen looks like:

If you tab over to the Threads window, you can space select the process, and drill into the stack traces for any of the running threads

You can also expand the regsiters by register class:

I’d like to know how to resize the various windows.  If you resize the terminal, the size of the stack view pane seems to remain fixed, so the symbol names always end up truncated.

Apparently this code hasn’t been maintained or developed since it was added.  Because there is no console pane, you have to set all desired breakpoints and continue, then pop into the GUI to look at stuff, and then <F1> to get back to the console prompt.  It’s nice that it gives you a larger view of the code, but given that lldb already displays context around each line, the lldb TUI isn’t that much of a value add in that respect.

This “GUI” would actually be fairly usable if it just had a console pane.