I recently watched Greg Law’s “I’ll change your opinion on GDB” talk from CPPCON 2015, where he gave a nice example of how to use the gdb TUI (text user interface) mode. I’d recently encountered the gdb –tui option, but thought that you had to have the foresight to remember to invoke gdb with –tui (which I usually didn’t, but also didn’t always want to since it’s redraw was flaky in a putty terminal session).
It turns out that there are command line keystrokes to enable TUI dynamically when you want it (or turn it off when you don’t). That makes this TUI a much nicer feature!
The main key commands of interest are:
– C-x a, turn on (or off) TUI mode.
– C-x 2. Use two windows, or cycle to the next layout.
– C-x o. Change active window.
– C-L. Redraw screen.
– C-x p. command history (since up and down move the cursor)
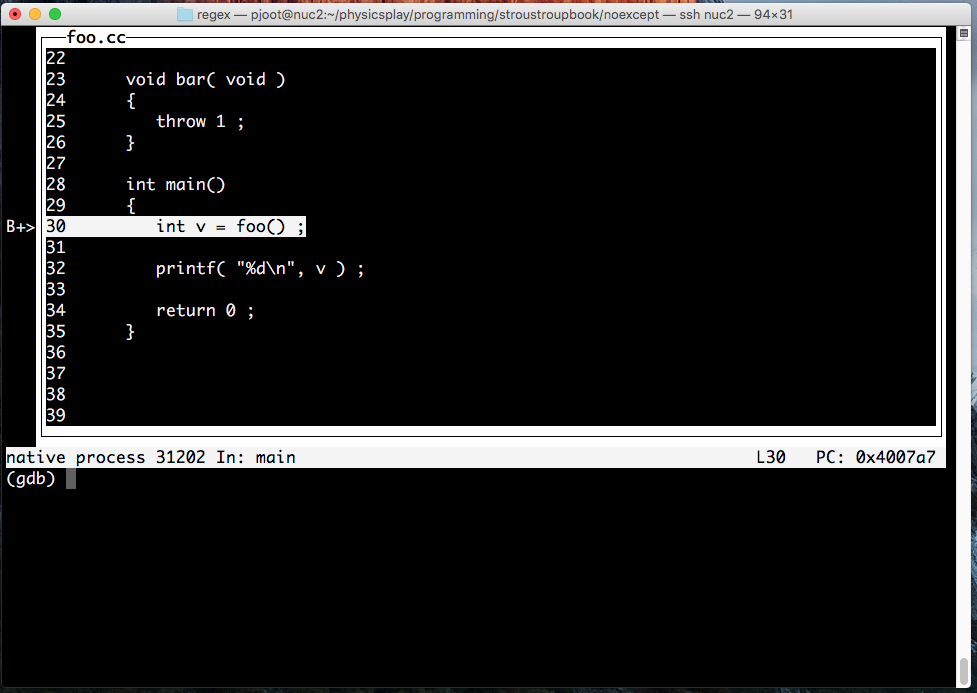
Here’s an example how things look after turning on TUI (C-x a):
After turning on two window mode (C-X 2):
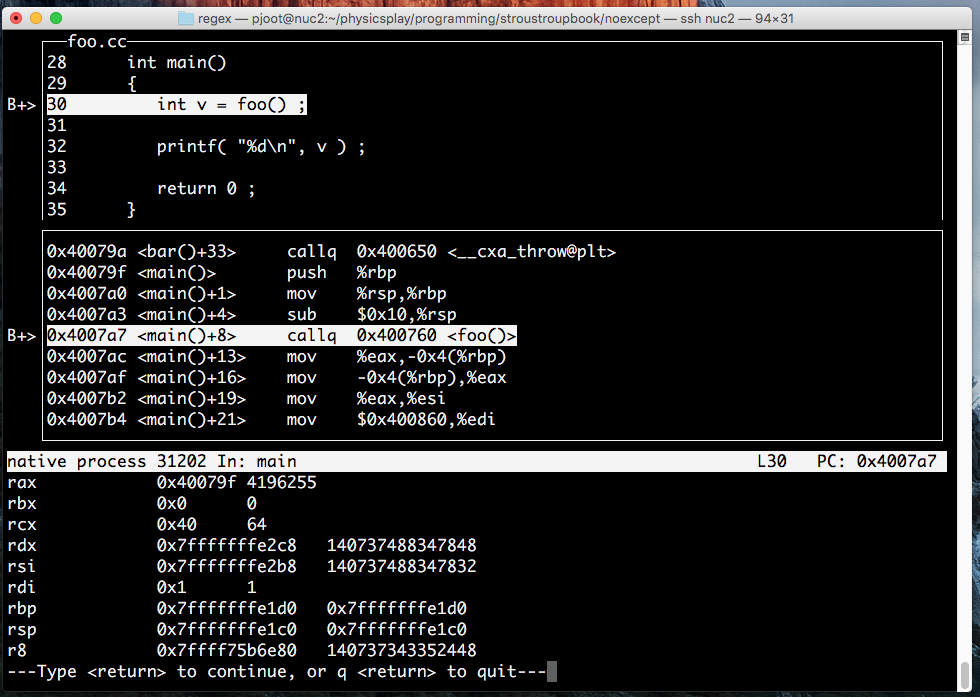
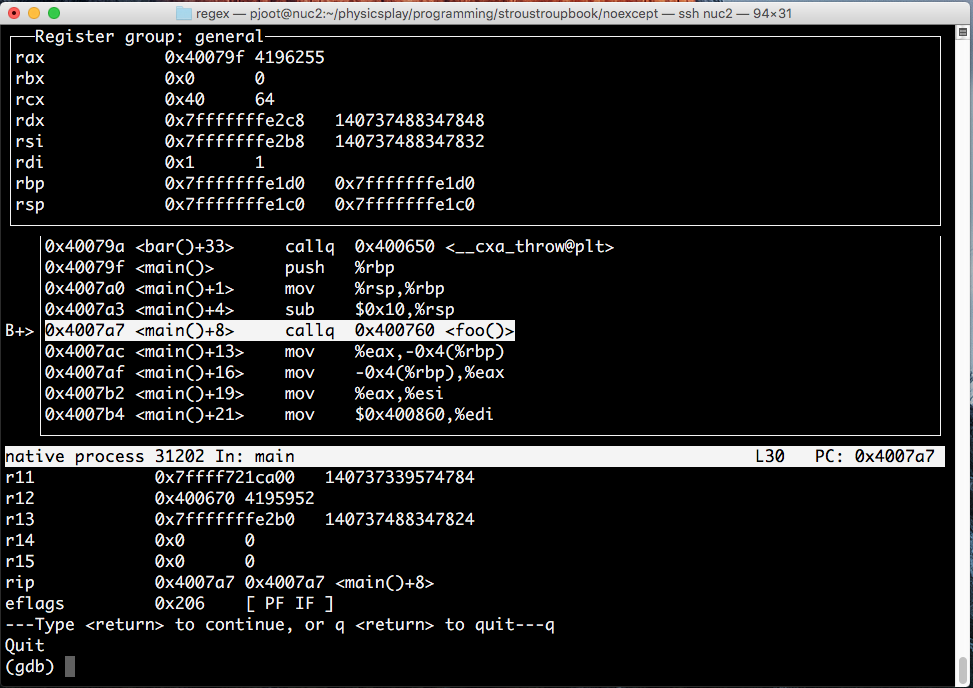
This has a source view, an assembly view, and the output of ‘info registers’. You can actually get a register window by cycling through the window layouts once (C-x 2 again) :
Some of the previous times that I’d tried ‘gdb –tui’ explicitly, I’d found it hit redraw issues, but didn’t really want to detach and reattach the debugger just to change the TUI mode. It sounds like such issues can be dealt with either by turning off TUI mode (C-x a), or using redraw (C-L).