I’ve been exploring 3D generalizations of the Mandelbrot set:
- Visualizing the 3D Mandelbrot set, and
- Some 3D renderings of the Mandelbrot set,
- Slicing of the 3D Mandelbrot set, and analysis.
The iterative equation for the Mandelbrot set can be written in vector form ([1]) as:
\begin{equation}
\begin{aligned}
\Bz
&\rightarrow
\Bz \Be_1 \Bz + \Bc \\
&=
\Bz \lr{ \Be_1 \cdot \Bz }
+
\Bz \cdot \lr{ \Be_1 \wedge \Bz }
+ \Bc \\
&=
2 \Bz \lr{ \Be_1 \cdot \Bz }
–
\Bz^2\, \Be_1
+ \Bc
\end{aligned}
\end{equation}
Plotting this in 3D was an interesting challenge, but showed that the Mandelbrot set expressed above has rotational symmetry about the x-axis, which is kind of boring.
If all we require for a 3D fractal is to iterate a vector equation that is (presumably) at least quadratic, then we have lots of options. Here’s the first one that comes to mind:
\begin{equation}
\begin{aligned}
\Bz
&\rightarrow
\gpgradeone{ \Ba \Bz \Bb \Bz \Bc } + \Bd \\
&=
\lr{ \Ba \cdot \Bz } \lr{ \Bz \cross \lr{ \Bc \cross \Bz } }
+
\lr{ \Ba \cross \Bz } \lr{ \Bz \cdot \lr{ \Bc \cross \Bz } }
+ \Bd
.
\end{aligned}
\end{equation}
where we iterate starting, as usual with \( \Bz = 0 \) where \( \Bd \) is the point of interest to test for inclusion in the set. I tried this with
\begin{equation}\label{eqn:mandel3:n}
\begin{aligned}
\Ba &= (1,1,1) \\
\Bb &= (1,0,0) \\
\Bc &= (1,-1,0).
\end{aligned}
\end{equation}
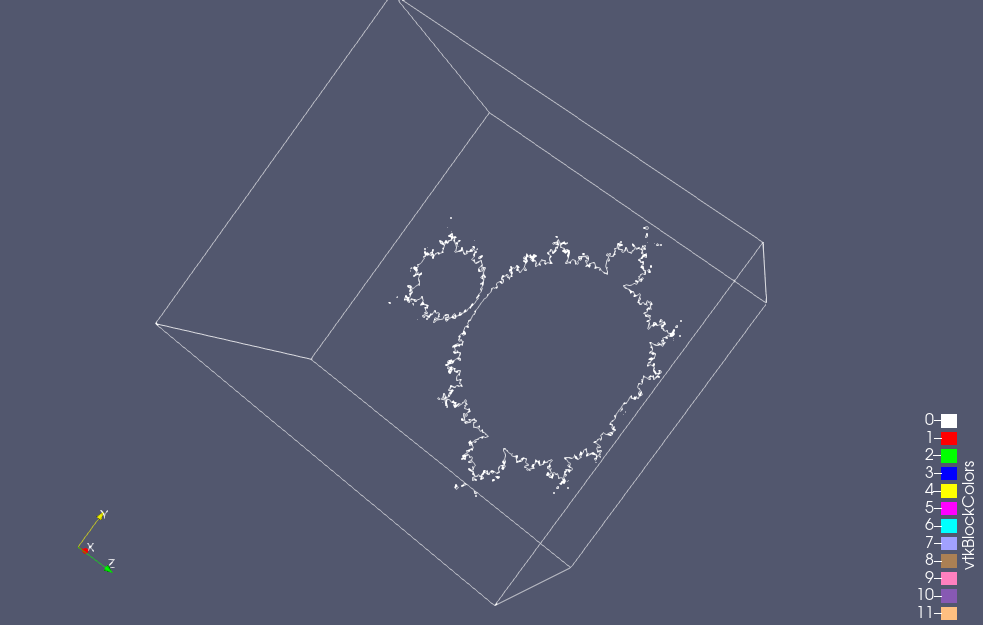
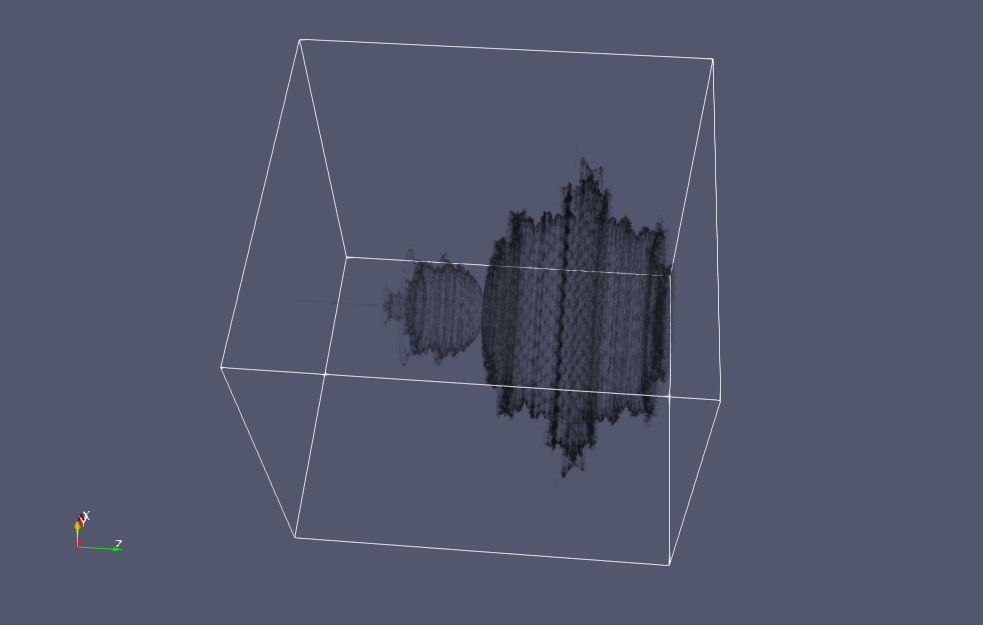
Here are some slice plots at various values of z
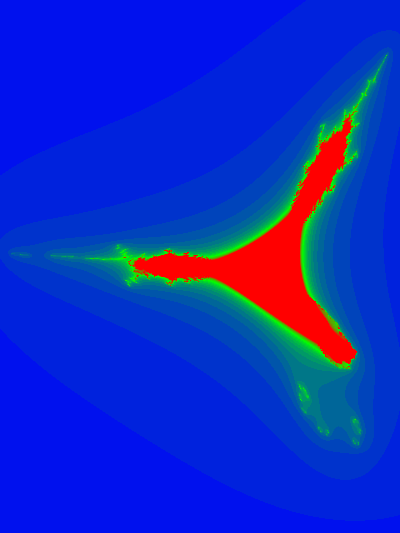
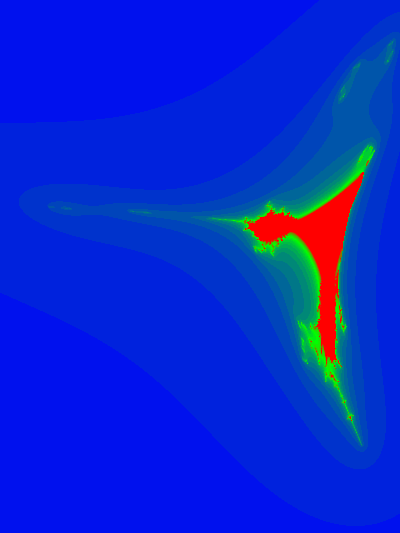
and an animation of the slices with respect to the z-axis:

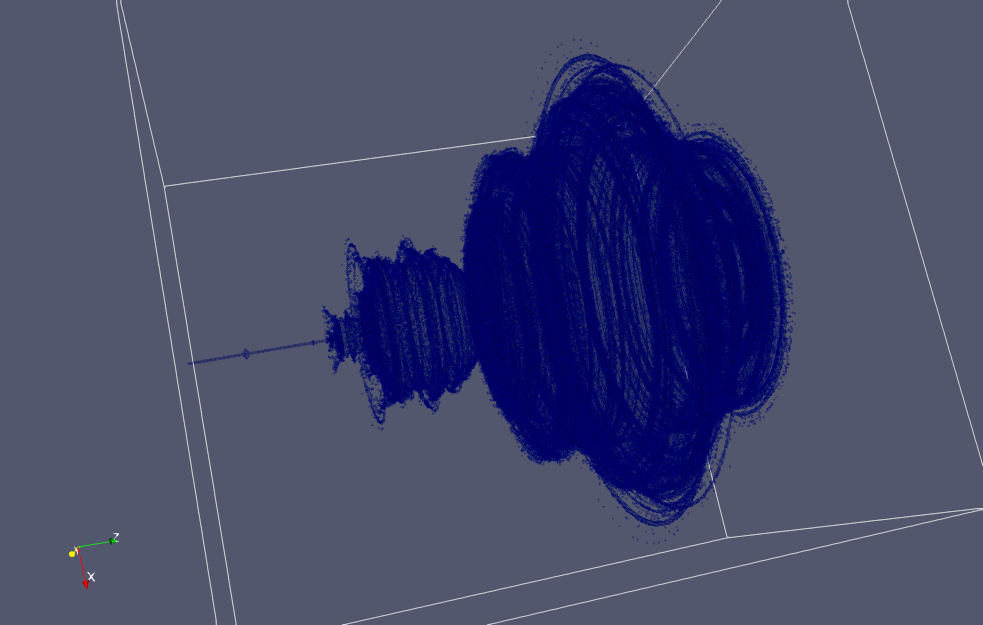
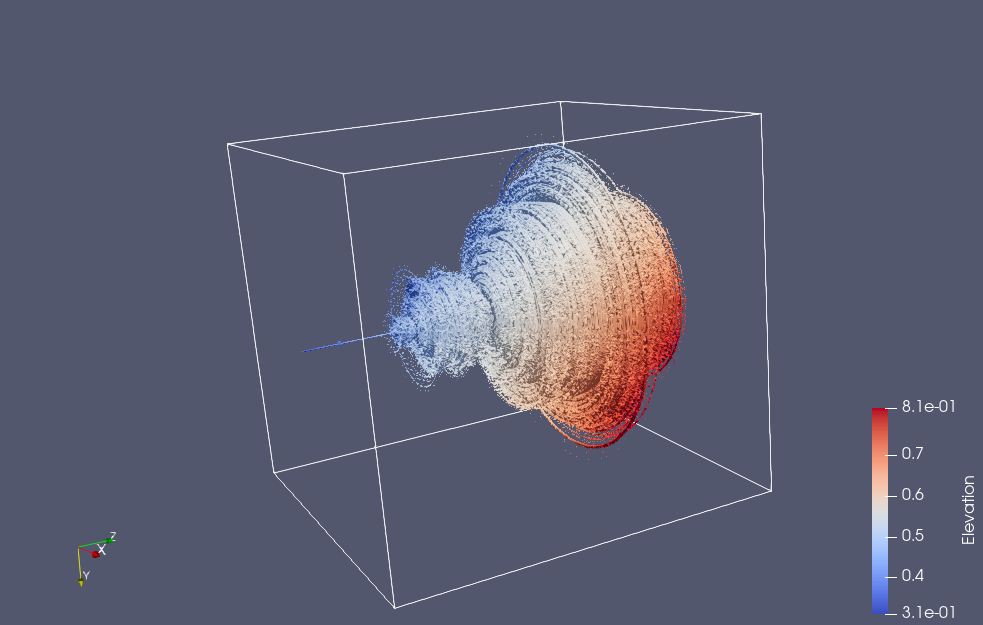
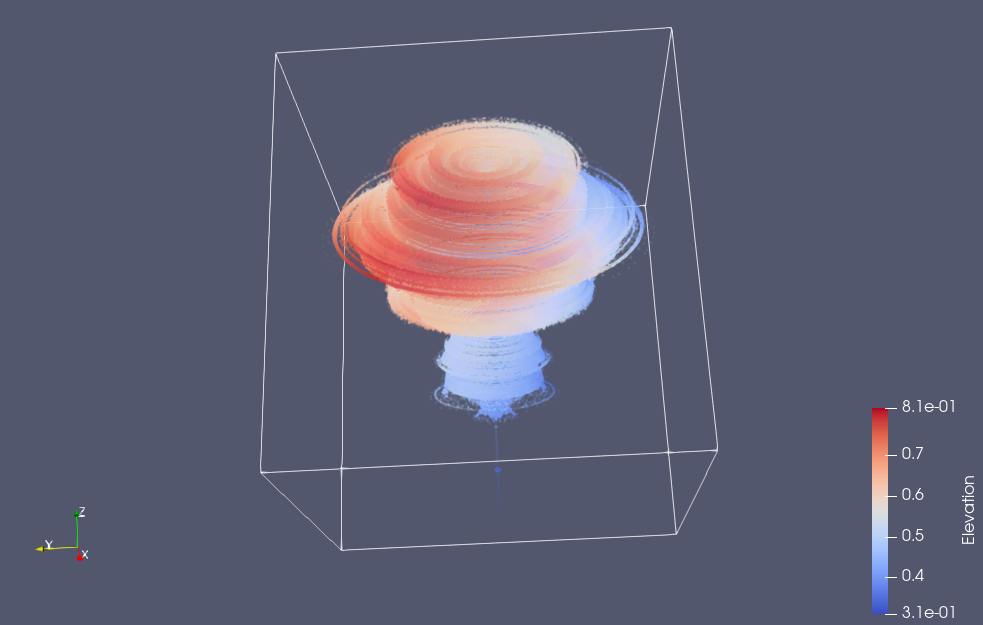
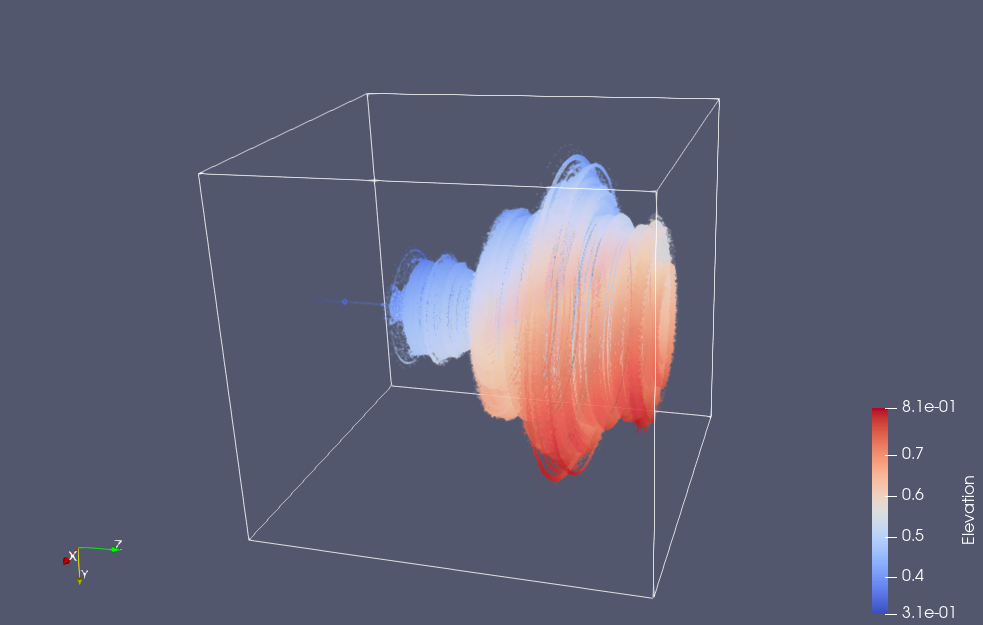
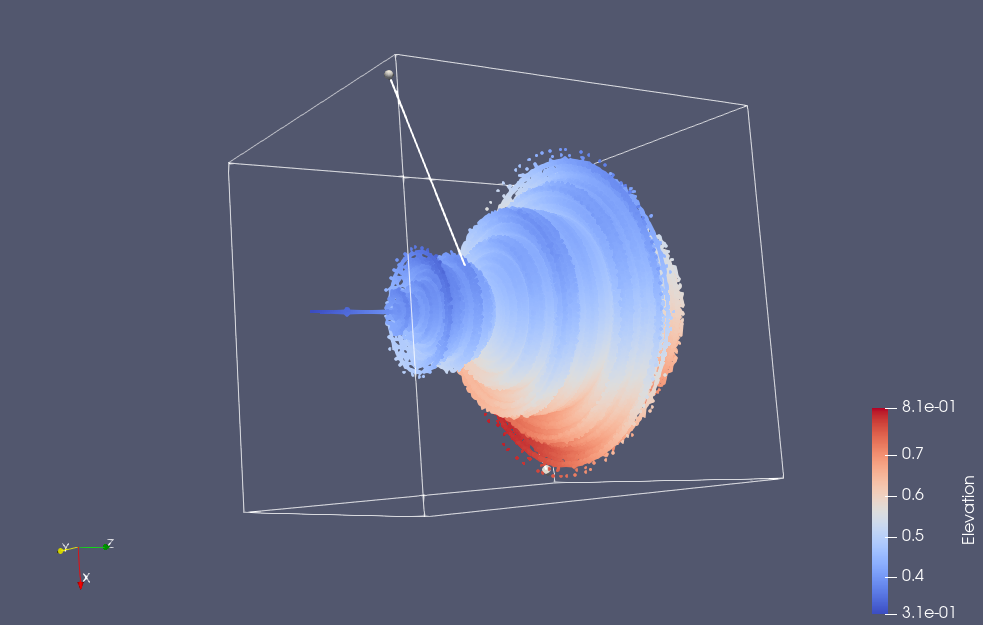
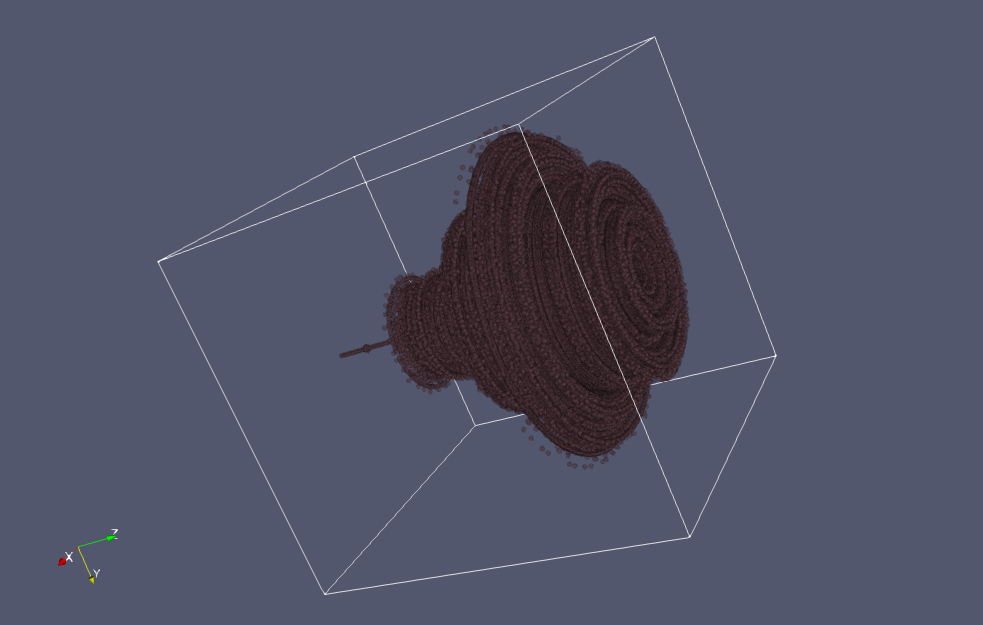
Here are a couple snapshots from a 3D Paraview rendering of a netCDF dataset of all the escape time values
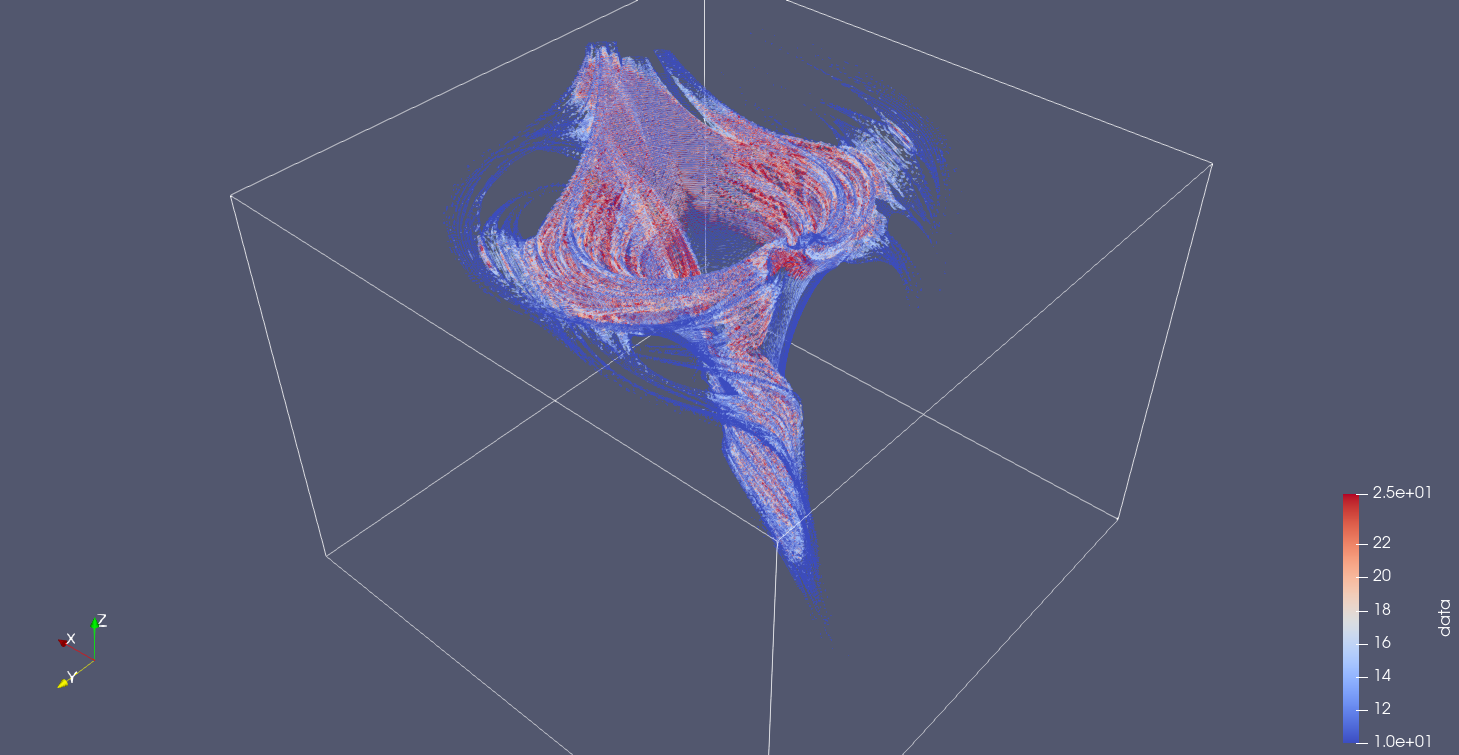
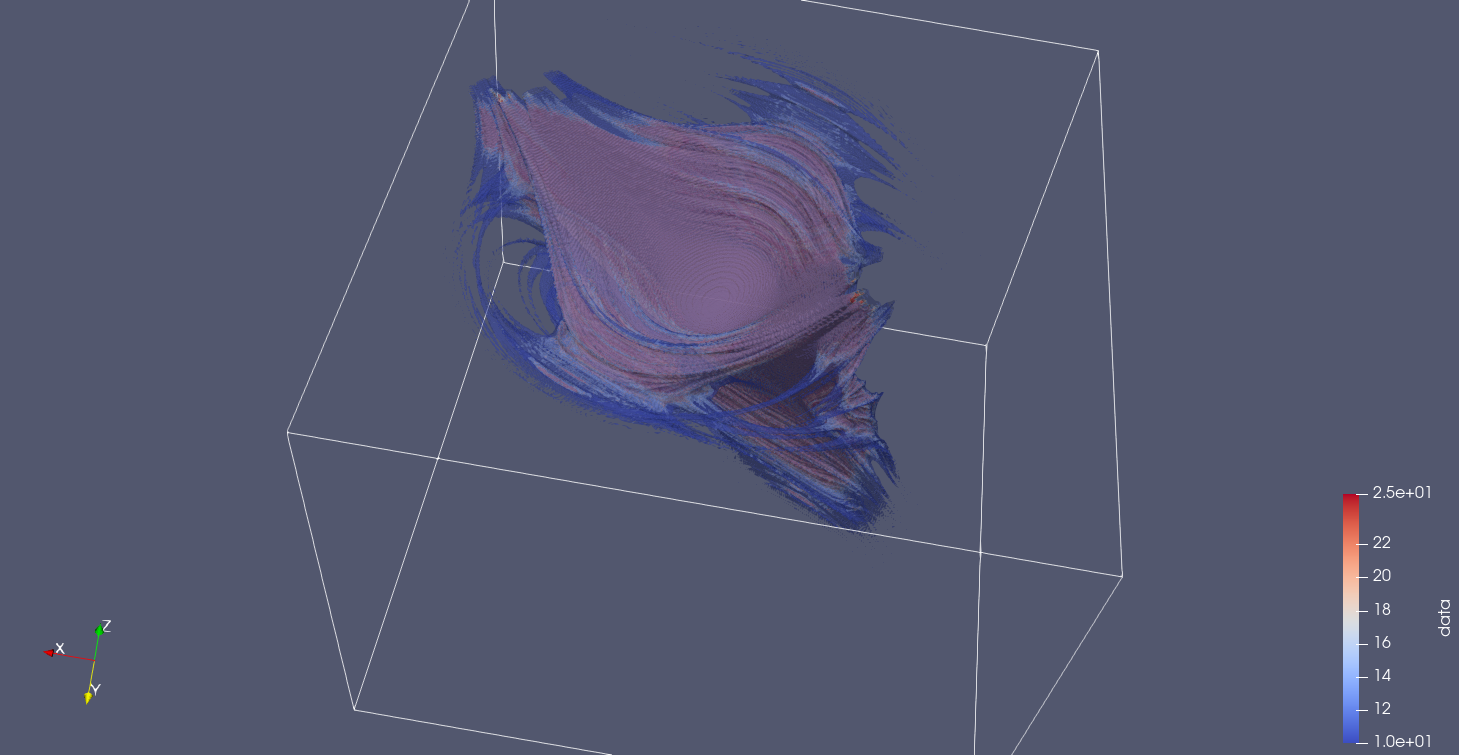
Data collection and image creation used commit b042acf6ab7a5ba09865490b3f1fedaf0bd6e773 from my Mandelbrot generalization experimentation repository.
References
[1] L. Dorst, D. Fontijne, and S. Mann. Geometric Algebra for Computer Science. Morgan Kaufmann, San Francisco, 2007.